Practical Ports: Monitor Your Hosts with Zabbix
I’d like to know what’s going on, especially on the servers and machines that I am responsible for. Monitoring those systems has become a good practice for me. There are simply too many to check on a daily basis, and most of the time, there’s nothing crazy going on. But when there is something going on, I want to know about it, even when it happened while I was asleep or otherwise away from a terminal. Monitoring also gives me an overview of my fleet of machines. I sometimes discover a host that has served its purpose but has not been recycled yet. I’ve even had cases where I could move new services to an underutilized machine, rather than spin up another host or jail.
Graphs serve me well in displaying what the machine has been doing over a period of time. Was last week’s system load unusual or did lab groups in the university start? That disk is slowly filling up, I better do something about it. Questions like these come up and graphs over the collected machine metrics help answer them.
Any good sysadmin will sleep better knowing that their systems are up and running. Monitoring software can tell you they are, and you can even give management an uptime report for each individual machine to fill PowerPoint slides.
A monitoring system that can do all these things is called Zabbix. It is an open source solution to monitor your IT infrastructure, developed by a company that can even provide professional support if needed. The fully featured solution I am using is running on a long-term support cycle and I found the installation to be well documented. A central server collects the data from the systems running an agent. The server provides a web UI with dashboards, graphs, alerts about certain events, and much more. Another bonus for me was that FreeBSD is not an unknown operating system, and Zabbix has machine templates available to monitor important metrics like CPU, RAM, and even ZFS.
I run Zabbix from a jail and do not have any major problems with it. The PHP-based solution requires a database for storing the metrics. Postgres, MySQL/MariaDB, SQLite and even commercial DB2 from IBM and Oracle database servers can be used. The monitoring itself happens via SNMP/IPMI, ssh or a simple ping to check availability. For active monitoring (collecting live machine metrics), an agent needs to be installed on those hosts. There are even functionalities in place to monitor whole subnets for new hosts and add them to monitoring as they appear There are even functionalities in place to monitor whole subnets for new hosts and automatically add them to monitoring when they first appear. Triggers set on certain hosts for specific situations (for example, disk full) are configurable via the web interface. Alerts about these events are sent via email, Jabber, SMS, or via custom script actions.
Zabbix Setup
Let’s see how we can install this monitoring solution. I’m starting out with a fresh FreeBSD 14.0 jail that is connected to the network that I’m monitoring and that downloads required packages from the web or a separate Poudriere server. Note that I configured the port from using the default MySQL to use PostgreSQL by running “make config” in the net/mgmt/zabbix64-server ports directory.
These are the packages that we need:
# pkg install zabbix64-server zabbix64-frontend-php82 postgresql15-server nginx
In an earlier attempt, I was using zabbix6-server and frontend, because I thought version 6.4 would eventually become version 6.5. But the release schedule for Zabbix is a bit different. The long-term support versions are the major versions (6 in this case), whereas the minor release versions (6.4) have a shorter support cycle. I switched to the long-term support version, as I didn’t want to be on the bleeding edge of monitoring and can run with the current feature set for a while. Stability is what I want as a primary goal. You don’t want to fix your monitoring every time a new version comes out, when you rely on monitoring your critical systems with it.
Activate services to run when the monitoring host (or jail) starts using sysrc:
# sysrc zabbix_server_enable=yes
# sysrc zabbix_agentd_enable=yes
# sysrc postgresql_enable=yes
# sysrc nginx_enable=yes
# sysrc php_fpm_enable=yes
I don’t use SNMP in my setup (that may change in the future), but the pkg-message has details about how to enable the SNMP daemon if you do. Our first task after the package installation is to set up the zabbix database. I love Postgres, so I use that in my setup here. As mentioned, other databases are supported, so pick your favorite data storage solution here.
Database Setup
First, I change to the postgres user, which was installed as part of the package.
# su postgres
After switching to /var/db/postgres (which is the postgres home directory), I run the initdb command to initialize the database cluster. Then I start the database using the pg_ctl command since we need a running database to import the Zabbix base tables.
$ cd /var/db/postgres
$ initdb data
$ pg_ctl -D ./data start
Once the database is running, I switch to
/usr/local/share/zabbix64/server/database/postgresql/
where the database templates for the tables, triggers, and everything else resides
$ cd /usr/local/share/zabbix64/server/database/postgresql/
Then I run PostgreSQL’s interactive shell called psql. In there, I create a new database for zabbix, a user with the same name and give it a password. After granting that user permissions on the zabbix database, I need to log out from psql to switch to the zabbix user we just created.
psql -d template1
psql> create database zabbix;
psql> CREATE USER zabbix WITH password 'yourZabbixPassword’;
psql> GRANT ALL PRIVILEGES ON DATABASE zabbix to zabbix;
psql> exit
Use psql again to log in as the new zabbix user into the empty zabbix database. We load three files that contain table definitions for zabbix (and some other database objects) in that order: schema.sql, images.sql, and finally data.sql from the local directory we changed into earlier. Once we’re done, we can log out of the database again.
$ psql -U zabbix zabbix
psql> \i schema.sql
psql> \i images.sql
psql> \i data.sql
psql> exit
That is all that is needed for the database. Let’s move on to configuring Zabbix itself.
Zabbix Configuration
Zabbix needs to know which database to use to store metrics, machines to monitor, and a whole lot of other information. The main Zabbix configuration is located in /usr/local/etc/zabbix64/zabbix_server.conf as a straightforward key = value file. Comments describe what the values do and most of them are commented out. After I made the necessary changes, my file looks like this:
SourceIP=IP.address.of.monitoring-host
LogFile=/var/log/zabbix/zabbix_server.log
DBHost=
DBName=zabbix
DBUser=zabbix
DBPassword=yourZabbixPassword
Timeout=4
LogSlowQueries=3000
StatsAllowedIP=127.0.0.1
The first thing that I defined is the SourceIP address of the central Zabbix server that collects the metrics. Note that the frontend (the web UI) does not have to reside on the same host, but I keep things central here. I define where Zabbix should log any events that happen during its runtime (LogFile). Create that path and file if it does not exist as yet and set the owner to the Zabbix user (this is the one that came with the package installation).
No, I did not forget to set a value for the DBHost parameter. When running on Postgres, this needs to be empty. One day, when you have to define your own config file, you may think back about this and may do things differently. Less typing for me, and remember, other databases may require a value here, so adapt your setup if you don’t use Postgres.
DBName, DBUser, and DBPassword (in clear text) are the ones that we created earlier in the database setup. This connects Zabbix to the database instance to store and retrieve values during monitoring. Both Timeout and LogSlowQueries are default values I kept. I had no need to adjust them yet, but I can imagine resource constraints would be a good reason to do just that. Internal statistics for Zabbix itself are collected as well and the StatsAllowedIP parameter defines from where to accept those. Localhost is totally fine for my use case. Another Zabbix instance may want to access those as well, which is why you can define multiple addresses here if you have several Zabbix servers monitoring each other.
That’s it for the server configuration file, at least for the basics. I’m using Agent monitoring for both the clients and the server itself. When using SNMP, there may be additional values required. Check the documentation for Zabbix for details.
Zabbix Agent Configuration
The gent is aptly named Zabbix Agentd (good old Unix daemons) and it should run when the server jail starts. The entry for /etc/rc.conf is done using sysrc and looks like this:
# sysrc zabbix_agentd_enable=yes
Located next to the server configuration file is the one for the agent, too. The filename is zabbix_agentd.conf in /usr/local/etc/zabbix64/zabbix_agentd.conf. My own changes make this file look like the following:
LogFile=/var/log/zabbix/zabbix_agentd.log
SourceIP=IP.address.of.host-to-monitor
Server=IP.address.of.monitoring-host
ServerActive=127.0.0.1
Hostname=Zabbix server
We find familiar lines in this file. The LogFile should be a different one to distinguish messages from the server and the client, especially for the server. The machines that are monitored typically don’t run the server parts, so there is no mixing them up on those systems. The directory should exist by now, but the file needs a manual nudge via touch(1) to come into existence. SourceIP is exactly the same as the monitoring host sends its own metrics to itself. For other clients, set this to the IP or DNS address of that host in question. ServerIP stays the same on all systems, as we are using a central system to collect the metrics. ServerActive has been discussed above and Hostname is an identifier that Zabbix uses internally to keep systems distinct.
Zabbix Frontend
The Zabbix frontend requires a running webserver with PHP enabled and its own configuration file. The front-end needs to know how to get metrics and other data from the backend, which is why another configuration file requires the database credentials. The file in question is located in /usr/local/www/zabbix64/conf/zabbix.conf.php, right where the rest of the website files reside that make up Zabbix. A few comments will guide you to the lines that need to be filled with the proper values. Mine look like this:
<?php
  // Zabbix GUI configuration file.
  $DB['TYPE']             = 'POSTGRESQL';
  $DB['SERVER']           = 'localhost';
  $DB['PORT']             = '0';
  $DB['DATABASE']         = 'zabbix';
  $DB['USER']             = 'zabbix';
  $DB['PASSWORD']         = 'yourZabbixPassword';
  $DB['SCHEMA']           = '';
Additional settings about TLS encryption are left as an exercise to the reader. Definitely consider implementing that or someone listening on the wire may be able to determine a lot of information about the hosts sending their metrics to the central server on a regular basis. I omitted it here to keep the tutorial focused on the most important parts to make Zabbix run in the first place.
My webserver of choice is nginx, but any other will do just fine. The main nginx.conf after the changes had these lines in it:
worker_processes  1;
events {
  worker_connections  1024;
}
http {
  include             mime.types;
  default_type        application/octet-stream;
  sendfile            von;
  keepalive_timeout   65;
  server {
    listen            80;
    server_name       localhost;
    root /usr/local/www/zabbix64;
    index index.php index.html index.htm;
    location / {
      try_files $uri $uri/ =404;
    }
    location ~ .php$ {
      fastcgi_split_path_info ^(.+\.php)(/.+)$;
      fastcgi_param SCRIPT_FILENAME $document_root$fastcgi_script_name;
      fastcgi_param PATH_INFO $fastcgi_path_info;
      fastcgi_param REMOTE_USER $remote_user;
      fastcgi_pass unix:/var/run/php-fpm.sock;
      fastcgi_index index.php;
      include fastcgi_params;
    }
    error_page    500 502 503 504   /50x.html;
    location = /50x.html {
      root   /usr/local/www/nginx-dist;
    }
}
Note that this also misses the SSL/TLS setup that is now ubiquitous on the web. I was using an SSL proxy for the requests, but a Let’s encrypt solution is cheap and easy to implement. Again, I focus on Zabbix here.
For PHP itself, the configuration is a few lines away from production use. Edit /usr/local/etc/php-fpm.d/www.conf and change these settings to the values shown:
listen = “/var/run/php-fpm.sock”
Uncomment the following:
listen.owner
listen.group
listen.mode
The file /usr/local/etc/php.ini should use production values, so copy and rename /usr/local/etc/php.ini-production to that filename. We are not quite done yet, as the setup will check for certain PHP values later and complain about lower (or outright wrong) values. Change these to have a smooth experience (and change the time zone to yours):
date.timezone = Europe/Berlin
post_max_size = 16M
max_execution_time = 300
max_input_time = 300
I saved those files, ran sysrc nginx_enable=yes followed by starting all services that are part of the Zabbix stack:
service postgresql restart
service php-fpm start
service nginx start
zabbix_server start
zabbix_agentd start
Website Woes
That went fine and I saw a couple of lines appear in the log file for Zabbix (both the server and agent). Excited as I was, I went to my browser of choice and entered the URL for Zabbix. Nothing happened. A white screen with nothing on it greeted me. I restarted the services, checked the logs, and re-checked the configuration files. No effect, still the same white page. I tried a different browser, just to rule out any peculiarities. The white page was staring in my face, just the same.
Whenever you meet me at a BSD conference (which is a likely event), you’ll notice how little hair is left on my scalp. I could blame bad genes or environmental factors, but working in IT is a big contributor to why I pull my hair out in situations like this. This is supposed to work according to the documentation, so why is there nothing to see on the website?
This article would reach an unsatisfying end here if luck had not pointed me in the right direction. I had opened the Zabbix FAQ to read about other things when my eyes caught this section:
If “opcache” is enabled in the PHP 7.3 configuration, Zabbix frontend may show a blank screen when loaded for the first time. This is a registered PHP bug. To work around this, please set the “opcache.optimization_level” parameter to 0x7FFFBFDF in the PHP configuration (/usr/local/etc/php.ini file).
https://www.zabbix.com/documentation/current/en/manual/installation/known_issues
Solution
OK, so I went back to /usr/local/etc/php.ini and set the opcache.optimization_level like this:
opcache.optimization_level=0x7FFFBFDF
Obscure value as it may be, this setting may or may not be required when you, dear reader implements this. I kept it in there to avoid another round of hair pulling. Restarting the services one more time, I was greeted by the Zabbix web configuration. The setup itself is main confirming the PHP settings and values for the backend database. Set a password for the web frontend and then log in for the first time.
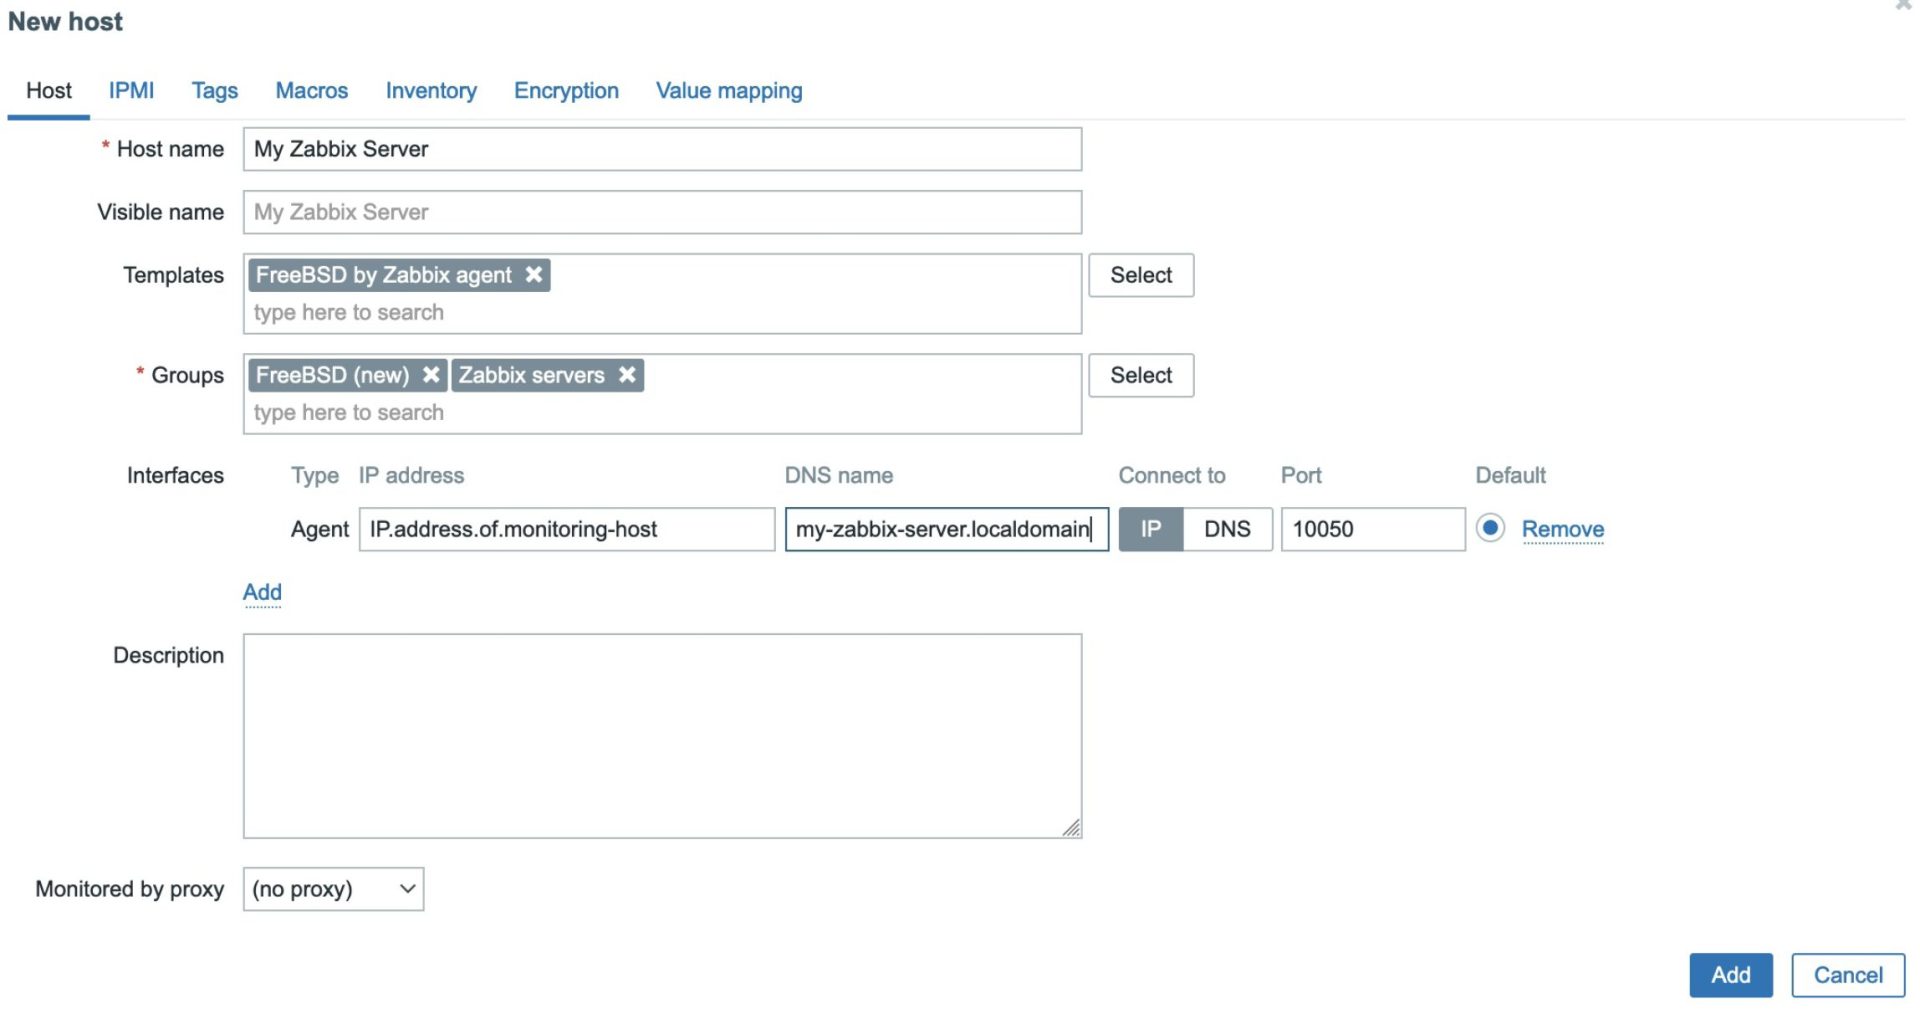
You probably do not see a host on a fresh installation. To see at least your own monitoring server, click on the left side (big eye icon) on Monitoring, and then Hosts. On the new page, click the “Create Host” button in the upper right corner. A form will appear where you can enter information about the host like name, IP address, and what kind of monitoring to use (zabbix agent in our case). The templates field holds presets for certain kinds of hosts, and we will find one for FreeBSD in there when we start typing that operating system name. Groups logically combine hosts that have similar characteristics (you can create as many groups as you need). This makes filtering easier, and if an outage occurs, may tell you what other systems need looking after. In the interfaces section, click “Add” and select Agent. New input fields will appear where you enter the IP address and/or DNS name. The port 10050 is the default for the agent, so check if any firewall rules prevent access. A description is optional, but with the growing number of servers, it’s good to remind yourself about a systems purpose. Click the blue “Add” button to create the host. It will appear in your host list, and if all went well, should have data collected by the agent as well as some graphs show up soon after. The dashboard will display any problems detected over the monitoring period.

Check the Zabbix documentation for monitoring a whole subnet, how to use SNMP monitoring, and how to automatically add hosts without having to click through each one of them in the Zabbix documentation. Explore the rest of the Zabbix UI for cool features that you never knew you missed but definitely want to regularly revisit to see if something is out of the ordinary. Happy monitoring!